BU's Emeritus Professor Nigel Jump writes the next in a series of economic blogs looking at the impact of Covid-19 on the economy.
Consider a simple economy with few outputs and people. One in which there is no savings and investment, and no international trade. One in which what is produced is consumed in the same period and there is no interfering government. Study of such an analogue reminds us of some basic relationships which will remain key to economic evolution in the 2020s.
Suppose this economy creates output of 30 units of goods and 70 units of services in the first period (year 1). Suppose there is £100 in currency available to spend on those goods and services. On average, they will cost £1 each (£100 currency/100 units of output). Now, suppose there is a shock (say, a pandemic lockdown?). In the next period (year 2), only 20 units of goods and 60 units of services are produced. Then, assuming no funds are hoarded/saved), the average price will move to £1.25 (£100 currency/80 units). In year 3, assuming the adverse shock is temporary, output goes back to 100 units and prices return to £1 each. Year 2’s price inflation of 25% caused by the lockdown shock was transitory.
Suppose, however, that, in year 2, the Central Bank adds £20 of currency to reduce some of the output shock by encouraging spending. Suppose this addition preserves 10 units of output compared with the first example, leaving a period total of 90 unit). The average price rises to £1.33 (£120 money/90 units). Once created, the increase in the money supply stands as output rebounds. In year 3, average prices move to £1.20 (£120 money/100 output) - 20% of the 33% rise in prices in year 2 is permanent and 13% is transitory.
The issue, then, is what happens in years 4 and 5 and so on. Does the money supply increase further? Does the economy produce more output? How do the price increases affect distribution of activity? Are there any productivity gains? If we can know or estimate such trends, we can forecast underlying inflation and growth from the relationship between how money and output are growing and how they affect prices. For example, suppose real output is growing by 1.5% per annum and the money supply by 3% per annum. In a simple world, underlying inflation will tend to rise 1.5% per annum (3% money - 1.5% output = 1.5% prices).
Now, the real world is more dynamic and more complicated than these simple relationships suggest. They are affected by complex lags, future expectations and other market and policy characteristics and changes: the behaviour and values of millions of producers and consumers, and savers and investors. The unknown balances of opinion and action in any given period is why economic forecasting is so difficult. Nevertheless, the basic relationships between output, prices and money do inform forward thinking about confidence and likely economic evolution.
In 2021, for example, we have some transitory inflation occurring because of the supply shocks caused by Brexit and the pandemic (e.g. petrol prices and building materials costs). Some of the inflation now being generated, however, may be permanently baked into the price level (perhaps, through subsequent wage increases). Also, because UK monetary growth is accelerating much faster than UK output growth, underlying inflation may be increasing too: (too much money chasing too few goods).
The question then is when and how the authorities will slow down the increase in the money supply to moderate underlying inflation back towards target (2% per annum)? When and how much will interest rates have to increase and QE (quantitative easing) be reversed? The Bank of England currently believes:
1) some permanent increases in prices are occurring; but
2) higher recorded inflation rates are largely transitory; and
3) the underlying rate of inflation will return to target over the next couple of years. Therefore, the Monetary Policy Committee is cautious about tightening its stance until it is sure more growth in output and jobs is secure. Many politicians, commentators and business representatives agree that, right now, the economy is too weak and unproductive to take on any monetary constraint. However, this cannot last forever. At some point higher interest rates and better control of the money supply seem inevitable.

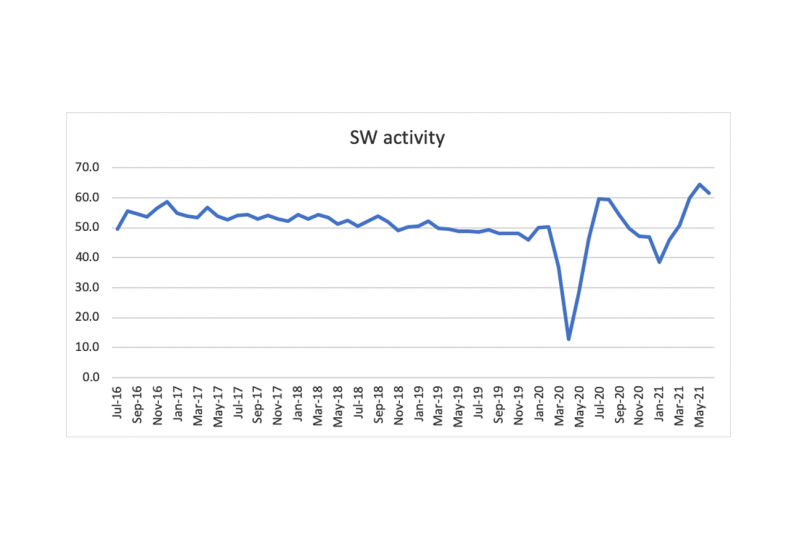
Meanwhile, the W-shaped economic recovery remained on track through June (see chart), with employment and prices rising in response to orders growth and continuing supply chain constraints. UK real GDP was up 0.8% in May: the fourth month of growth in a row, though still leaving output 3% below the pre-pandemic peak. But growth may be already slowing with consumer demand uncertain in several areas and supply chains fragile. Some signs are stronger (e.g. transport, cars and housing), but others are not. ‘Holes’ in the data remain. Those working may be more productive but those idle are not. The ‘misery index’ is climbing (from 6.8 to 7.2 = 2.4% inflation plus 4.8% unemployment).
An interesting experiment is underway with the Covid-19 relaxation in England countered by continuing restrictions elsewhere. Allowing the third coronavirus wave to evolve without much lockdown, makes the economy even more unpredictable than usual. It may result in (more or less) inflation and growth by sector or region, with differential impacts affecting firms and their workers.
Social distancing, mask-wearing and other restraints are now a personal matter, relying on the goodwill and good sense of the population and individual businesses and services. Bosses are complaining about the ‘pinging into isolation’ of key vaccinated workers, adversely affecting stretched supply lines. Consumer confidence and business optimism, crucial drivers for the next stage of recovery, are fragile as we all wait for a ‘new normal’ to emerge.
As always, the key to sustained recovery is productivity growth and this requires long-term investment in education, mobility, and technology. The UK would do well to:
1) raise its relative education standards;
2) level up its relative regional inequality; and
3) innovate relatively well in new sustainable growth (rather than re-distributive systems and markets).
That is the route to keeping the flows between money, prices and output in positive and sustainable balance.
The ‘roaring 1920s’ recovery from a previous pandemic (and WW1) eventually founded on inequality and political tension (fascism and isolation), some hyperinflation (Weimar Republic) and asset booms, leading to austerity and defaults (Wall St Crash and Great Depression). It is to be hoped similar experiences do not occur in the 2020s. The authorities must remember the basic interrelationships between money, inflation and growth as outlined here, as well as any envisaged structural shifts in trading patterns and environmental values. The rest of us need to think about these permanent, transitory and underlying variables too, for the future wellbeing of our families and communities.


